Formula Interpolate#
Functionality#
This node is designed to perform interpolation between several control points.
The user defines control points by specifying expressions for X and Y coordinates. Given these control points, the node will take another value of X and calculate the corresponding Y by interpolating between the control points.
The node supports linear and cubic interpolation.
Expression syntax#
Syntax being used for formulas is standard Python’s syntax for expressions. For exact syntax definition, please refer to https://docs.python.org/3/reference/expressions.html.
In short, you can use usual mathematical operations (+, -, *, /, ** for power), numbers, variables, parenthesis, and function call, such as sin(T).
One difference with Python’s syntax is that you can call only restricted number of Python’s functions. Allowed are:
Functions from math module:
acos, acosh, asin, asinh, atan, atan2, atanh, ceil, copysign, cos, cosh, degrees, erf, erfc, exp, expm1, fabs, factorial, floor, fmod, frexp, fsum, gamma, hypot, isfinite, isinf, isnan, ldexp, lgamma, log, log10, log1p, log2, modf, pow, radians, sin, sinh, sqrt, tan, tanh, trunc;
Constants from math module: pi, e;
Additional functions: abs, sign;
From mathutlis module: Vector, Matrix;
Python type conversions: tuple, list, dict.
This restriction is for security reasons. However, Python’s ecosystem does not guarantee that no one can call some unsafe operations by using some sort of language-level hacks. So, please be warned that usage of this node with definition obtained from unknown or untrusted source can potentially harm your system or data.
Examples of valid expressions are:
1.0
t
t+1
0.75*X + 0.25*Y
R * sin(phi)
Note: This node does not allow to use the variable x (small X) in the expressions.
Inputs#
This node has the following input:
x. The value of X variable to calculate the interpolation for. The default value is 0.5.
Each variable used in the formulas will also becaome an additional input.
Parameters#
This node has the following parameters:
Control points. Here the expressions for control points X and Y variables are defined. Each row in the list defines one control point. Control points are added by using the [+] button under the list. It is possible to move rows by using the arrow buttons near each row. It is possible to remove the rows with [-] button at each row. Note: when performing the interpolation, all control points are automatically sorted so that values of X coordinate are in ascending order. So you can specify the control points in any order you see comfortable.
When the Interpolation mode parameter is set to Cubic, then there is a button to toggle the control point type between “smooth” and “sharp”. By default, all control points are smooth.
Interpolation mode. This defines the interpolation algorithm. The available values are Linear and Cubic. The default value is Cubic.
Cyclic. This defines how the Y values are calculated when the provided value of X is outside of the range specified by control points. If not checked, then the node will just extrapolate using the interpolation spline. If checked, then the X value will be taken modulo the range defined by control points. Unchecked by default.
Outputs#
This node has the following outputs:
Result. The result of interpolation for the specified X value.
Curve. Interpolation Curve object built by the specified control points. It will be always lying in the XOY plane along the OX axis.
ControlPoints. The control points, evaluated with respect to the provided variable values. Z coordinate of these points will always be zero, so they all will be lying in the XOY plane.
Examples of usage#
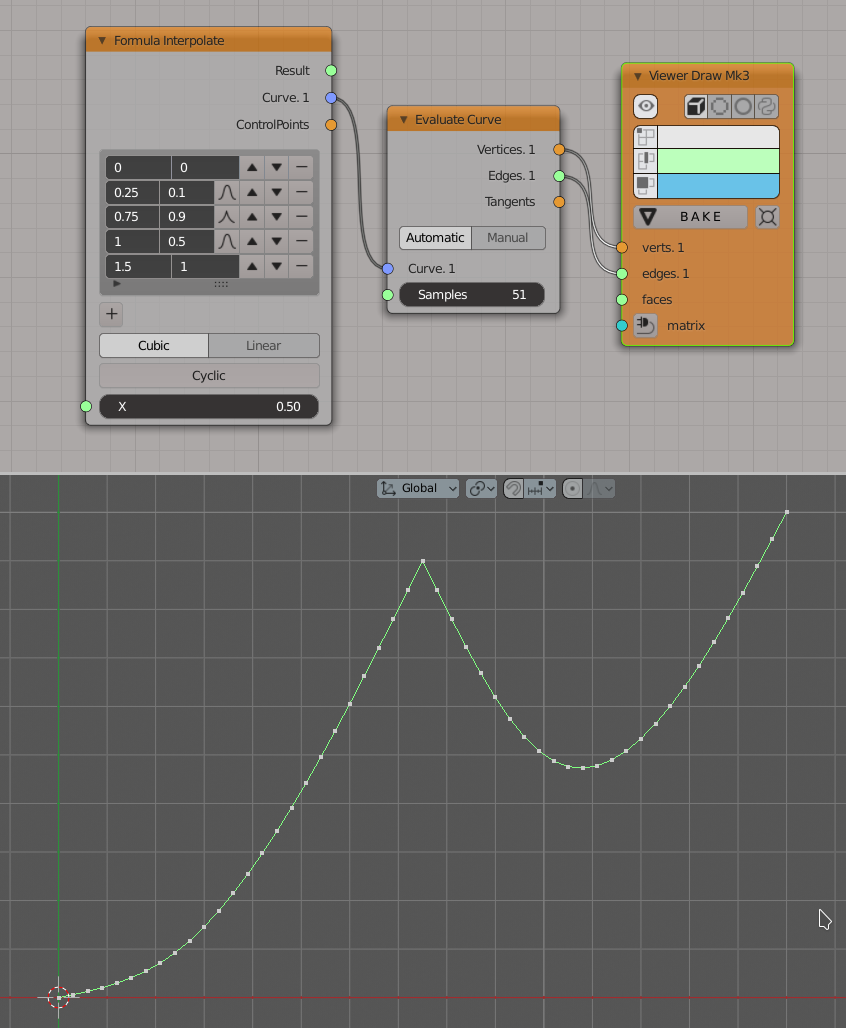
Visualize the interpolation curve defined by three control points:
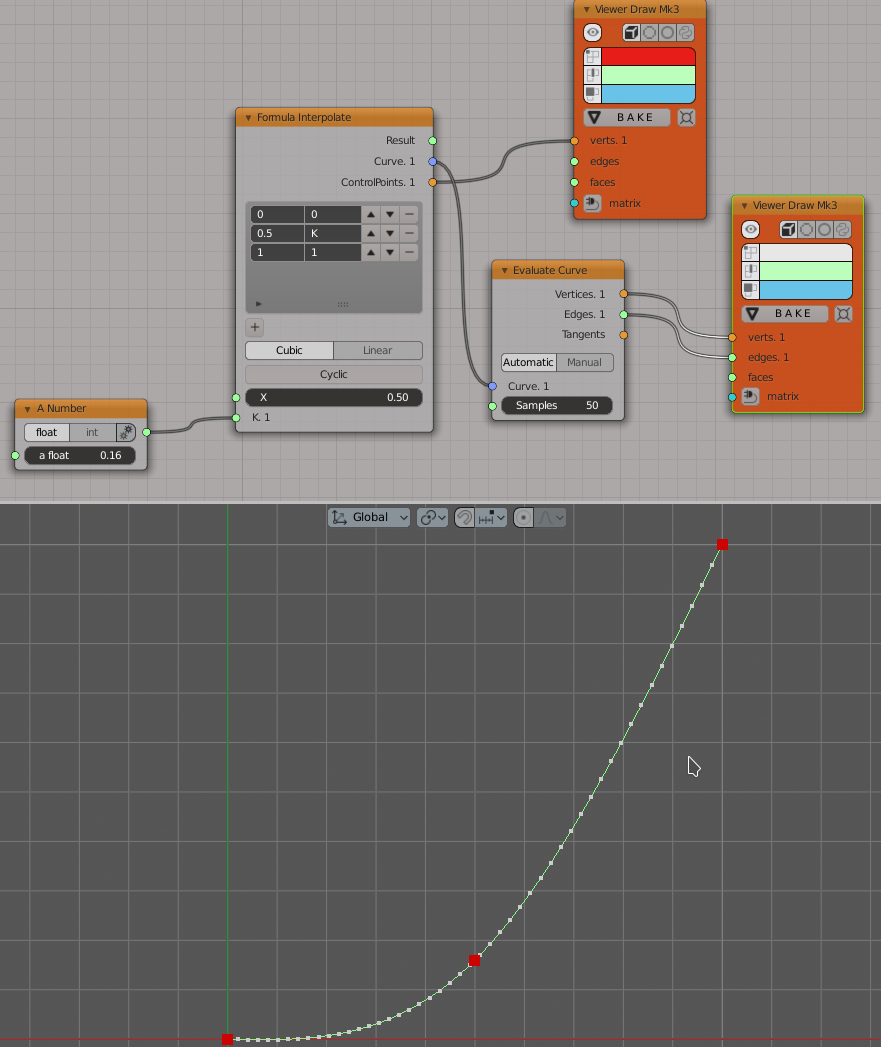
Note that here user can move the middle control point along Y axis by adjusting the value in the K input.
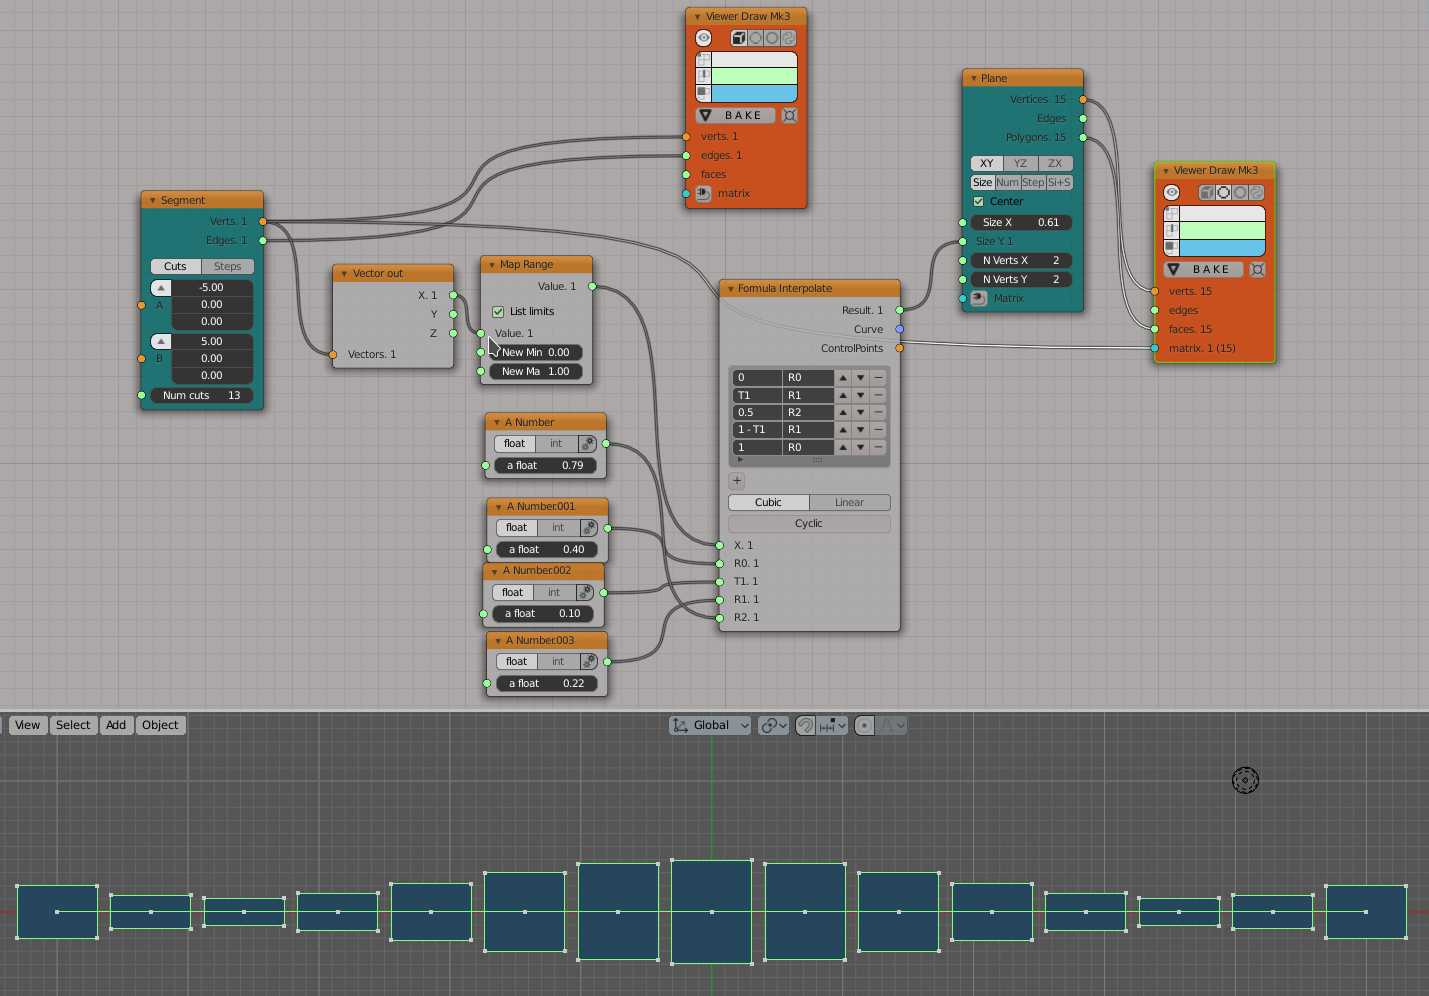
Use interpolation between five points to scale some objects:
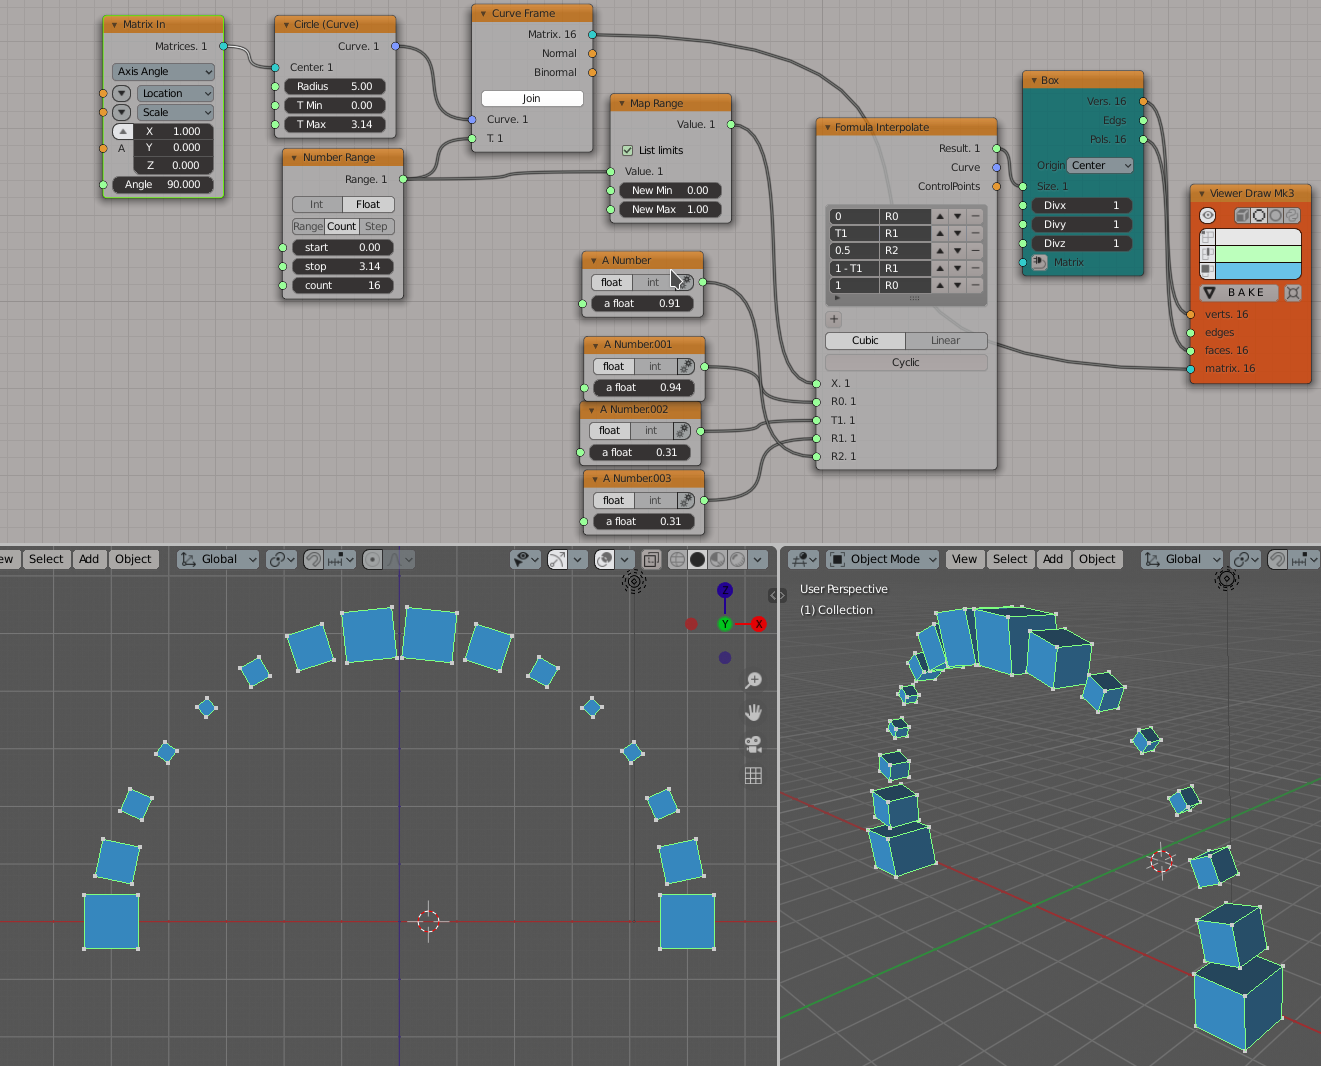
Similar example with object placed along some curve:
An example of sharp control points usage: