Curve Mapper#
Functionality#
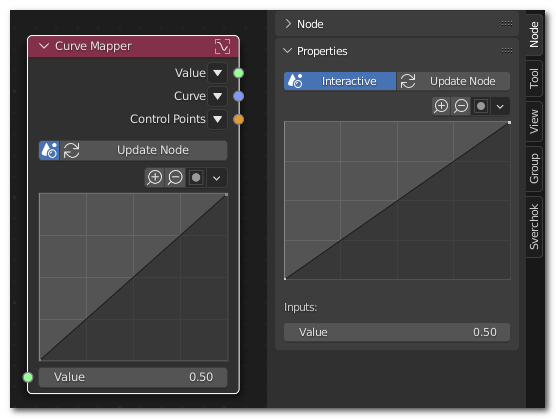
This node map all the incoming values using the curve you define manually through the interface.
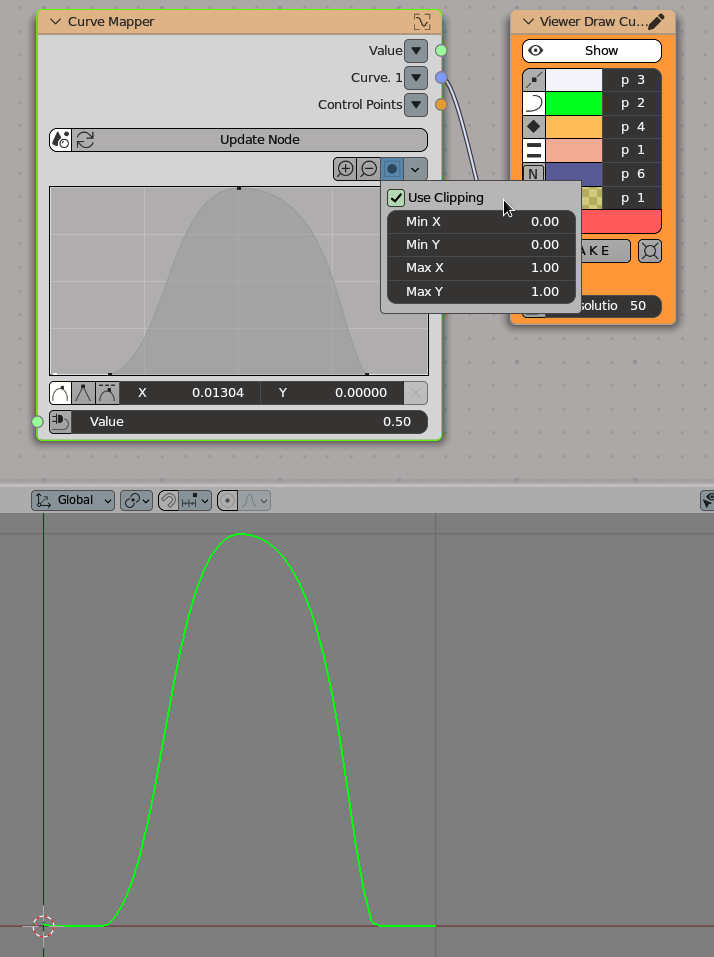
Note: the curve defined by the widget may give results in any range, from minus infinity to plus infinity. However, by default, the “use clipping” checkbox in curve widget’s settings is enabled; the node respects that checkbox. It means, that if, for example, Min Y and Max Y parameters in the curve editor widget are set to 0.0 and 1.0, then, even if the curve goes beyond that range, the node results will be always within 0.0 - 1.0 range. If you do not need such clipping, you can disable it in curve widget settings.
Disclaimer#
This node creates a Blender material node-group and uses “RGB Curves” nodes to create and store the curve. Due the nature of this implementation the changing the curve will not trigger the node update. To update the output you need to click in the “Update” button or perform another action that triggers the node-tree update.
Inputs#
This node has the following input:
Value. The value to be used as an input for the function. The default value is 0.5.
Outputs#
This node has the following outputs:
Value. The result of the function application to the input value.
Curve. A Curve object, representing the mapping. This curve will be always lying in XOY plane along the OX axis. The domain of the curve is defined by Min X and Max X parameters, which are defined in the curve editor widget.
Control Points: Location over the XOY Plane of the control points of the widget. It can be used as a 2D slider.
Examples#
Basic range remapping:
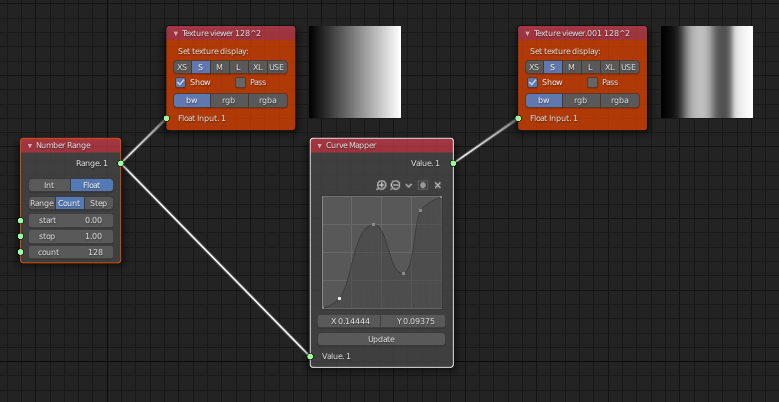
Number-> Number Range
Viz-> Texture Viewer
Using the node to define the column profile:
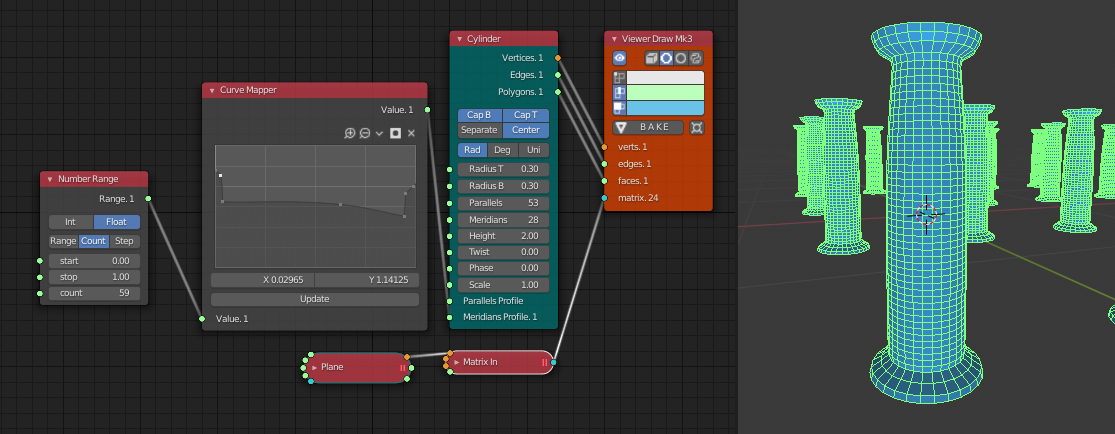
Generator-> Cylinder
Generator-> Plane
Number-> Number Range
Matrix-> Matrix In
Viz-> Viewer Draw
Example of the Curve output usage:
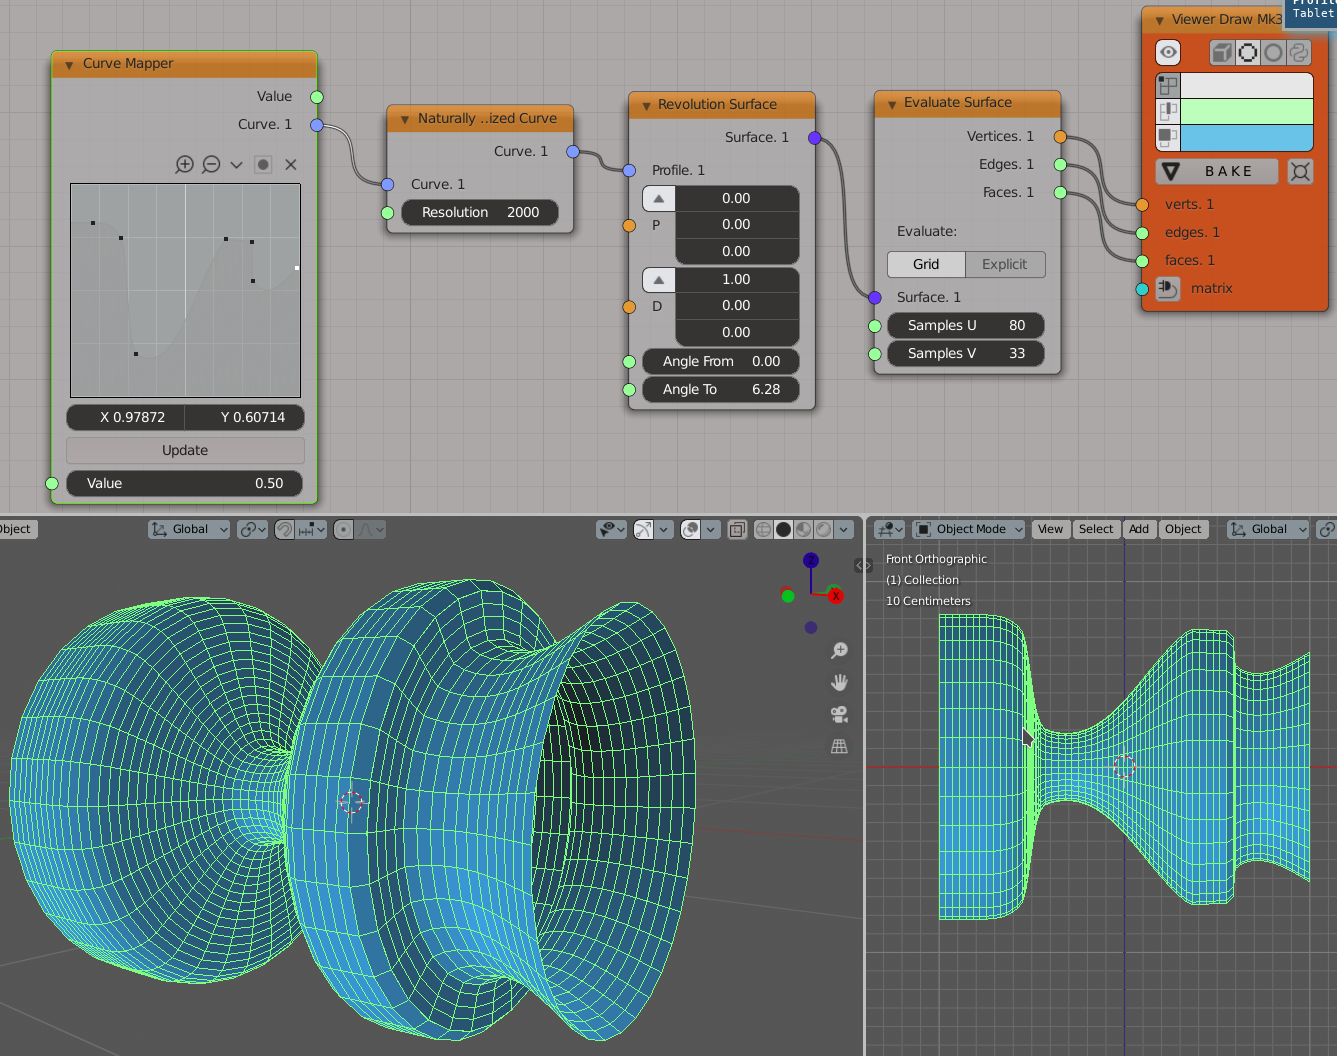
Curves-> Naturally Parametrized Curve
Surfaces-> Revolution Surface
Surfaces-> Evaluate Surface
Viz-> Viewer Draw
An example of what the node can do if you disable the “use clipping” option:
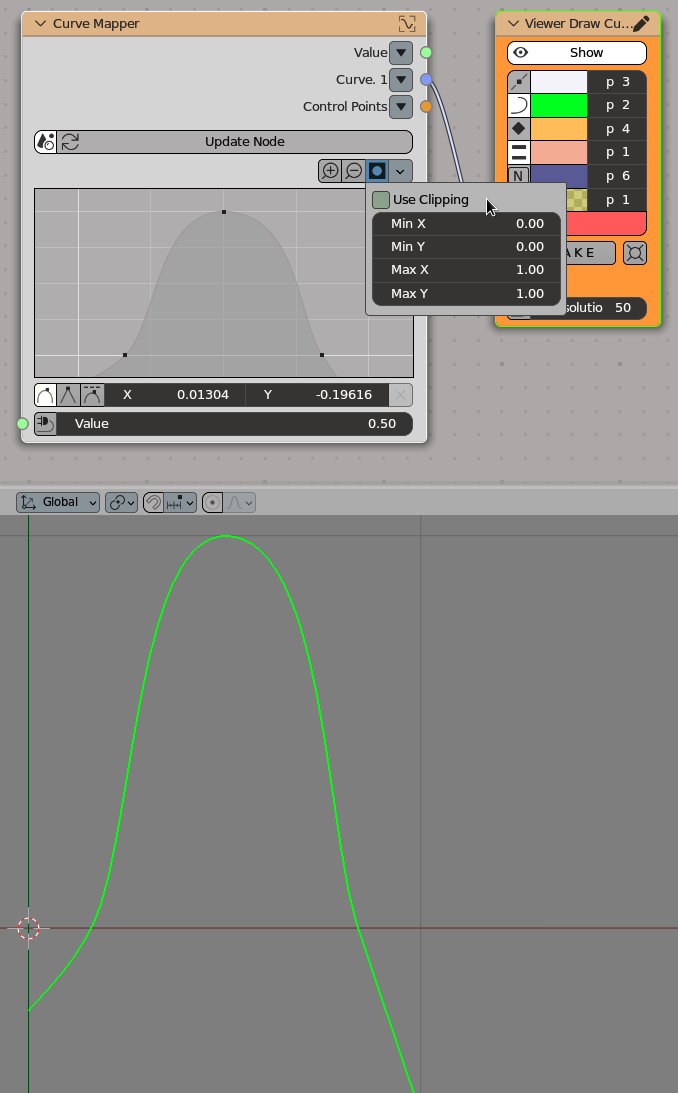
The same curve with enabled clipping: